Share investing in the stock market is thrilling but at the same time challenging as well. The IFCI has emerged as one of those stocks that have lately gained much attention. This article intends to look deeper into IFCI, its current trends, technical levels, and what the future holds for this interesting stock. Let’s dive deep into the technical aspects, as well as the reasons why traders are keeping a close eye on this stock.
DISCLAIMER: Our post is only for educational purpose only. Not an investment advice. Consult your financial advisor before investing.
Short History of IFCI
One of the oldest financial institutions of India is IFCI, an institution formed way back in the year 1948. Being a significant group in providing financial support to sectors of infrastructure, manufacturing, and services, IFCI has been an important part of India’s industrial landscape. Its historical role caught the attention of many traders. Nowadays, however, its technical patterns attract many. Some traders are watching very carefully to see where IFCI may go from here.
Why Support Levels are Important-The Golden Zone of IFCI
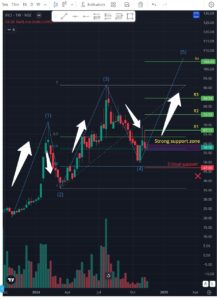
When trading stocks, one ought to understand support levels. Support levels refer to the price where a stock tends to stop falling due to the interest shown by buyers. IFCI is currently trading in a very strong support zone between 56 and 59. Not some random range, but famously known as the ‘Golden Zone’ in technical analysis jargon, specifically within Fibonacci retracement.
This Fibonacci tool is very widely applied in technical analysis. It was based on the series of numbers that would help determine some possible reversal points in a stock’s movement. In the case of IFCI, its Golden Zone falls in between the 61.8% and 78.6% retracement levels. These numbers are very important because they will hint at the place where the stock might change direction. If IFCI stays within this zone, the bull trend might be sustained.
Higher Highs and Higher Lows : Bullish Sign for IFCI
One of the positive signs that one may see on the chart of IFCI is the formation of higher highs and higher lows. The pattern says that there is an upward trend where the buyers are coming in at higher levels. This is quite a sure indication that there is the bullish momentum, and, hence, the technical analysts feel it to be an important sign.
The pattern like this is also useful according to Elliott Wave Theory. According to the theory, stocks move in certain patterns of waves which help in forecasting their future trends. If the pattern of IFCI matches with an Elliott Wave hand in glove, it may forcaste that other moves are coming soon. This way, more interest is being accrued for IFCI in terms of interest on the hopes of gains in the traders’ world.
Promoter Holding: Confidence about IFCI’s Future
Therefore, while evaluating a stock, holdings by promoters are very important. This is because the company’s key figures, promoters, hold a certain stake in the company, showing their level of confidence. In IFCI, promoters hold a substantial 71.72% stake, which goes to show that it really cares about its prospects. Those who know the company better have taken confidence in it, which is a value for long-term investors and thus makes the stock more attractive.
Target Levels for IFCI: What’s Next?
Technical Analysis releases the following target levels, where traders are paying attention to next for IFCI
67: A short-term level where initial resistance could be felt
75: A mid-term level that would indicate more continuation of the bulls
84: The most important point of confidence in a long-term trend of the bulls
90: Major Check Point for the vigil investor who is glued to the stock very closely.
100+: If IFCI aligns with the anticipated Elliott Wave then it can touch 100 and even do new highs.
These levels are computed by the integration of various technical tools like trend lines, resistance points, and pattern analysis.
Critical Level Support at 47
While the bullish trends are very exciting, very importantly not to be ignored are the potential risks. One critical support level to watch for IFCI is 47. If it goes below that number, then a bearish trend shift could be in place. The level itself is an indicator of this respect, and crossing below it may lead to a rethink of strategy for trading. It is a red flag for the traders; they must therefore check closely.
Why IFCI is on Traders’ Radar
There are several reasons that make the share of IFCI an attractive bet for traders:
1. Golden Zone (Fibonacci): Presently, in this zone, the stock should see either a reversal or the continuation of a positive trend.
2. Higher Highs and Higher Lows: It indicates a stable uptrend, reflecting buyer interest.
3. Strong Promoter Holding: A 71.72% holding by promoters reveals that they are confident about the potential of the company.
4. Elliott Wave Theory: If the current trend goes with the principles of this theory, then further rally may be witnessed.
Conclusion
Line of Sight
IFCI looks promising on the ground, but always tread with caution. While one looks at IFCI, keep these points in mind:
1. Regular Monitoring: Look for how the stock performs in the Golden Zone between 56 and 59. The stock’s movements outside that range could show that things are changing.
2. Levels of Support (47): If the stock falls below 47, it could be a bearish breakout. Review your strategies at this point.
3. Gradual Approach: Do not go for the three-digit targets all at once. Target one level first, like 67, then 75, 84, and 90, as market conditions suggest.
4. Be updated on the latest news about IFCI, since it would be coming up on its performance and financial health or has happened in the recent past.
What IFCI Has in Store?
The coming weeks and months are very crucial for IFCI as it crosses key levels and patterns. Whether you are a short-term trader who seeks short-term gains or a long-term investor who looks at stability, you need to watch the support and resistance levels of the stock.
Remember, stock trading is risky and unforeseeable. Even though IFCI presents promising features at present, do your own background research. Set up a consultation with your financial advisor, remain updated, and know your risk tolerance before getting to a final decision.
Conclusion: Final Thoughts on IFCI
IFCI presents a very interesting scenario in the way technical indicators point toward further upside gains. However, one thing about the stock market is always unknown, and past trends are no promise for the future. It would be a good time to be watching on some of these key support points, the promoted confidence of the company, and market conditions before making a move.
If you found this analysis useful, be sure to also follow our updates. If you want to receive daily insights into the market, join a trading community, and be updated about news with IFCI and other stocks, subscribe to our Telegram channel.
Happily trading, stay patient, and learn!