Introduction
The Relative Strength Index, or RSI Indicator, is one of the most widely traded momentum indicators by traders. A momentum indicator basically helps a trader find out how the price of a particular stock is actually moving. With this in mind, learning to use RSI can add considerable value to decisions made in any trading environment: whether you’re a novice trader or an advanced one.
What is RSI?
RSI means Relative Strength Index, which was developed by J. Welles Wilder Jr. It indicates the speed of price movements along with changes. RSI varies between 0 and 100, indicating how overbought or oversold a stock is.
For example:
- Over 75-80 : Overbought zone-Price might reverse or consolidate
- Below 25-20 : Oversold zone-Price may bounce
How RSI Works
RSI is calculated using a mathematical formula that compares the average gains and losses over a specific period, usually 14 days.
Formula:
RSI = 100 – [100 / (1 + RS)]
Where RS (Relative Strength) = Average Gain / Average Loss
Let’s simplify: RSI checks how strong the recent price gains are compared to the losses. If gains dominate, RSI moves higher. If losses dominate, RSI drops.
Why RSI Matters in Trading
RSI is important since it is a guiding tool in terms of momentum in the market. Knowing if a stock has reached the overbought or oversold state will guide one in making informed buy/sell decisions.
For instance:
- Overbought: Prices are too high, and one can expect a correction.
- Oversold: Prices are too low and may rebound.
How to Use RSI Indicator Correctly
1. Overbought and Oversold Levels
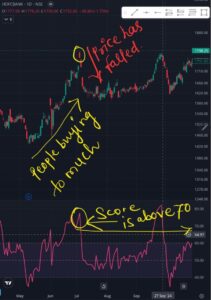
- When the RSI crosses above 75-80, the stock is overbought. You are not forced to sell but must be vigilant.
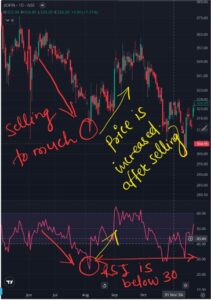
- When RSI goes below 25-20, it means the stock is oversold. This can be a buy signal.
2. Divergences
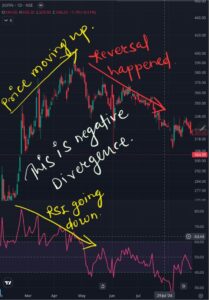
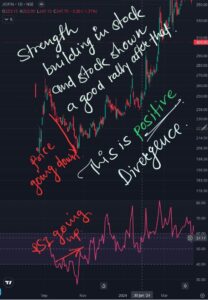
When the price moves in a different direction to the RSI, it is known as an RSI divergence.
- Bullish Divergence: Price goes lower low but RSI makes a higher low. This indicates that there could be an upward reversal.
- Bearish Divergence: Price goes higher high but RSI makes a lower high. This means there might be a downward reversal.
3. Trend Confirmation
RSI can also confirm trends. If RSI remains above 60 during an uptrend, it confirms strength. If RSI remains below 40 during a downtrend, it confirms weakness.
Common Mistakes While Using RSI Indicator
- Relying Only on RSI
RSI is not a standalone indicator. Use it with other tools like moving averages or support/resistance levels. - Ignoring Context
RSI functions differently in trending and ranging markets. It can stay overbought or oversold for a long time in strong trends. - Overtrading
Don’t trade each and every RSI signal. Look for quality setups.
Example: RSI in Action
Suppose you are analyzing Stock XYZ:
- RSI crosses above 75-80, and it signals the overbought condition. Don’t sell it immediately. You wait for the RSI to turn down.
- Later, RSI drops below 70, and the price starts to consolidate. This may be a signal to book profits or avoid fresh buys.
Similarly, in an oversold condition, look for RSI rising above 30 as a sign of recovery.
RSI Settings: Should You Customize?
The default RSI period is 14 days, but some traders adjust it:
- Short-term traders: Use a 7-day RSI for quicker signals.
- Long-term investors: Use a 14-day or 21-day RSI for smoother trends.
Customizing RSI depends on your trading style and strategy.
Combining RSI with Other Indicators
To make RSI more effective, combine it with:
- Moving Averages (SMA/EMA): Confirm trend direction.
- MACD: Validate momentum shifts.
- Support and Resistance: Strengthen entry/exit points.
RSI: Myths vs. Facts
- Myth: RSI is always accurate.
Fact: RSI is a tool, not a guarantee. Use it wisely. - Myth: Overbought means sell, oversold means buy.
Fact: These are just signals; consider the bigger picture.
Final Thoughts
RSI is a very powerful indicator, but its real power lies in how you use it. Be patient, backtest your strategies, and combine RSI with other tools for better results. Remember, trading is about probabilities, not certainties.
Learn the Difference Between SMA and EMA
